Climate Action (UN SDG 13): A Power BI Dashboard on Global Greenhouse Gas Emissions and Temperature Trends
Fifty-four billion tons, broken down by country, fuel, sector — and the 0.61% that's ours.
Data Analyst
Description
Fifty-four billion tons. That's how much carbon dioxide-equivalent the world emitted in 2021, up from 4 billion in 1850 — a 1,369% increase, and nearly double what it emitted as recently as 1970. A number that size is too big to hold onto. It needs to be broken into who emitted it, from what, and in which sector, before anyone can act on it.
The UN's public SDG data behind those numbers isn't one dataset — it's several: country-level emissions, per-capita emissions, temperature anomalies, emissions by fuel or industry, emissions by sector, each with its own countries, years, and grain. Flattening them into a single table would have meant duplicating rows every time two datasets didn't line up on country or year, and silently inflating totals. So I modeled five fact tables around four shared dimensions instead — Entity (country), Year, Fuel or Industry, Sector — so every page could filter by the same country and year without merging data that didn't belong together.
This was my final project for DataSense Analytics' Power BI Masterclass: take the UN's own SDG 13 (Climate Action) data and turn it into a report. On top of the model I wrote measures for year-over-year % change, each entity's share of global emissions, and per-capita emissions, then built four report sections — global emissions and temperature anomaly, emissions by fuel or industry, emissions by sector, and a dedicated Philippines page — each ending in a written summary instead of a wall of charts left for the reader to interpret.
The country rankings tell two different stories depending on which measure is doing the ranking. By raw totals, the United States, China, Russia, India, and Brazil lead 170 years of emissions, together with five other countries accounting for almost 60% of everything ever emitted. By per-capita emissions, an entirely different set shows up: Qatar, Bahrain, and Brunei, small in population but averaging over 70 tons of CO₂ equivalent per person a year in the most recent five years of data. Raw totals hide that; per capita doesn't.
Breaking emissions down by fuel and by sector shows where the totals actually come from: coal, oil, and gas have out-emitted cement and flaring since 1750, and Electricity & Heat, Transport, and Agriculture have been the top three emitting sectors since 1990 — with land-use change and forestry the only sector actually trending down. Even within a single fuel or sector, the leading countries shift: India entered coal's top three in the last five years where Germany used to sit, and Vietnam entered cement's top three where the United States used to be.
The Philippines page turns the lens on one country: 0.61% of global emissions from 1850 to 2021, down slightly to 0.49% in the most recent five years. It's a small share by any measure — and the report's own closing argument is that a small share isn't a reason to sit out. It points at Oil, Coal, and Cement as the industries to target and Agriculture, Electricity and Heat, and Transport as the sectors to change, the same categories that lead the global totals two pages earlier.
Fifty-four billion tons is easy to read past as an abstraction. Broken into country, fuel, sector, and person, it stops being a number nobody owns.
Highlights
- Five fact tables modeled around four shared dimensions (country, year, fuel/industry, sector), avoiding row duplication across differently-grained UN datasets
- DAX measures for year-over-year % change, per-entity share of global emissions, and per-capita emissions
- Four report sections, each closing on a written summary page instead of raw charts
- Country rankings recomputed by both raw totals and per-capita emissions, surfacing entirely different top emitters (US/China/Russia vs. Qatar/Bahrain/Brunei)
Screens
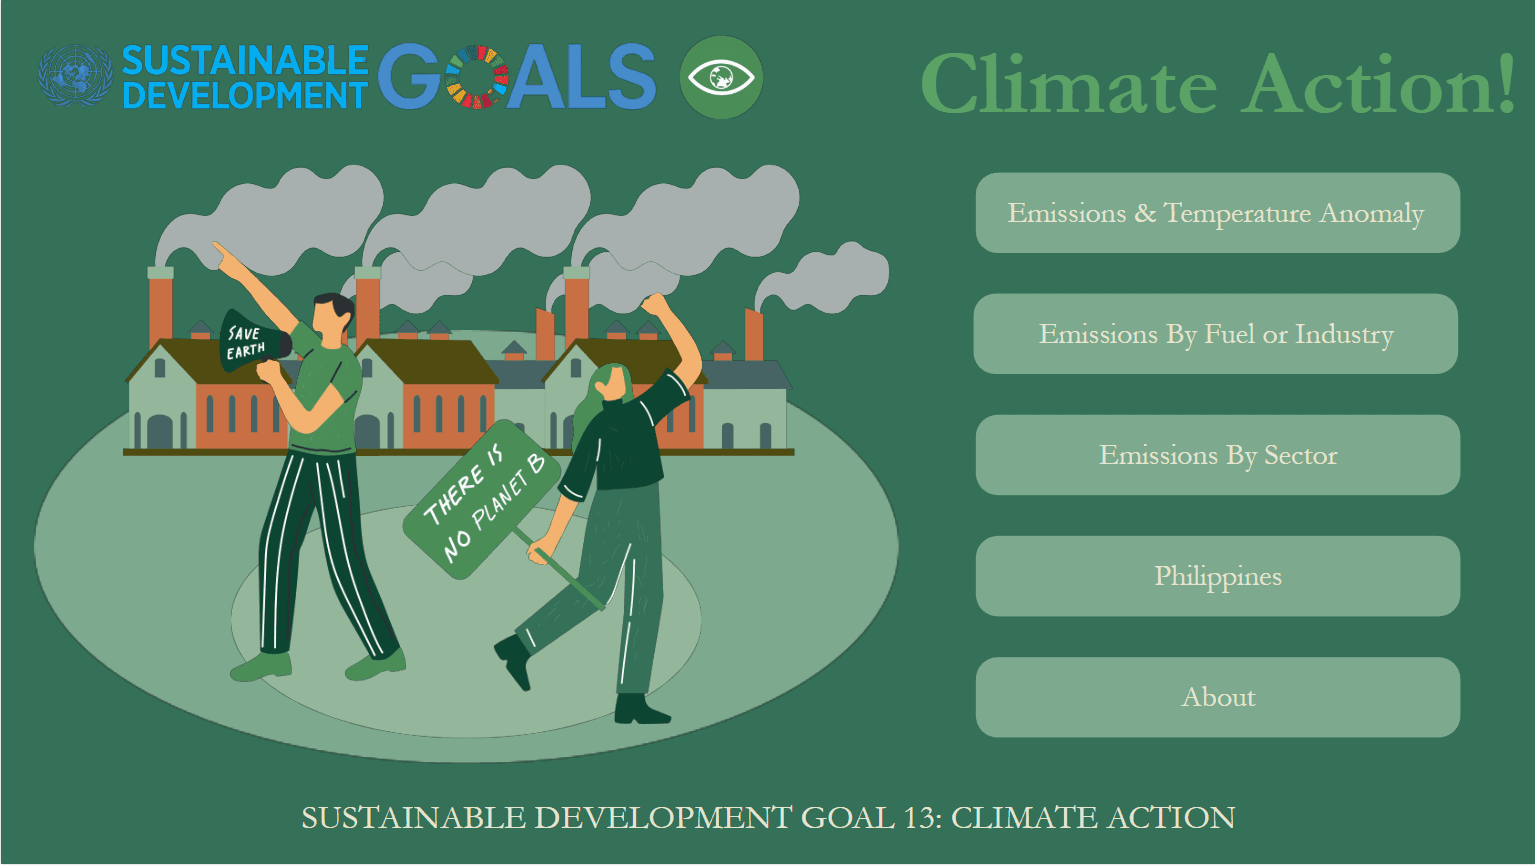
Screenshot 1 of 11: SDG 13 Climate Action landing page with navigation to each report section
Landing page, linking out to each of the four report sections.